





Table of Contents
ToggleOpening a second location feels like proof the model works. By the tenth, founders are asking whether it scales, and a more basic question can slip: can customers in each market find the business on Google?
It is an easy thing to miss, because revenue and staffing numbers roll up into one dashboard while local search visibility stays scattered across every market you operate in. Each location lives in its own map, with its own competitors and its own ranking picture, and that picture changes block by block.
Multi-location rank tracking exists to pull those pictures together. Done well, it tells a founder which locations are healthy, which are slipping, and which are effectively invisible, without anyone reading dozens of separate reports.
What Multi-Location Rank Tracking Measures
Multi-location rank tracking is the practice of monitoring how every location of a business ranks in local search, on the maps results people use to find nearby services, and comparing those locations side by side. The comparison exists to show which markets need attention first, something a single average across locations hides.
Local rankings are tied to physical position. A plumbing company might rank first for customers two streets from its shop and not appear at all five miles out. Multiply that by 10, 20, or 50 locations and the “average rank” on a summary slide stops meaning much.
For founders, the useful output is a ranked to-do list: the locations losing customers to a competitor right now, the new market that never gained traction, and the one that improved after a local push and might hold a playbook worth repeating elsewhere.
Why Multi-Location Rank Tracking Shows Most Locations Outside the Top 3
Most tracked locations are not winning on the map. In a sample of 50 GeoGrid scans that Local Dominator published, pulled from a live account tracking 274 businesses, 82% of the businesses sat outside the top 3. Only 18% ranked in the top 3, another 30% landed in positions 4 to 10, and 46% sat in positions 11 to 19.
Founders should worry most about that 46%. Positions 11 to 19 technically count as ranking, yet the sample’s own write-up describes that range as effectively invisible to most searchers, so a location stuck there looks fine in a spreadsheet while underperforming in practice.
Six percent of the sample, three of the 50 businesses, did not rank in the top 20 at all. Each of those is a location paying rent, payroll, and marketing costs while being close to invisible to the people searching nearby.
Your own split will vary by industry and market. If you run several locations and have not checked recently, the safest assumption is that a few of them belong to that 46% group.
Why Multi-Location Rank Tracking Breaks Down Report by Report
The standard response is to add more reports, so each location gets its own scan, its own PDF, and its own line in a monthly review. That setup is manageable at three locations and breaks down by fifteen.
Reading reports one at a time also spreads attention evenly across healthy and struggling markets. A location that needs a fix gets the same five minutes as one that is fine, and nothing in a stack of PDFs tells the reviewer which is which until each one has been opened.
Lean teams feel this most, since the person reviewing rankings is often also handling operations, hiring, or sales. Nobody in that seat reads 20 reports in a row every week, so the review slips to monthly, then quarterly, and problems compound in between.
Start Multi-Location Rank Tracking From One Map
A better sequence starts with one view of the whole portfolio and drills down only where something looks wrong.
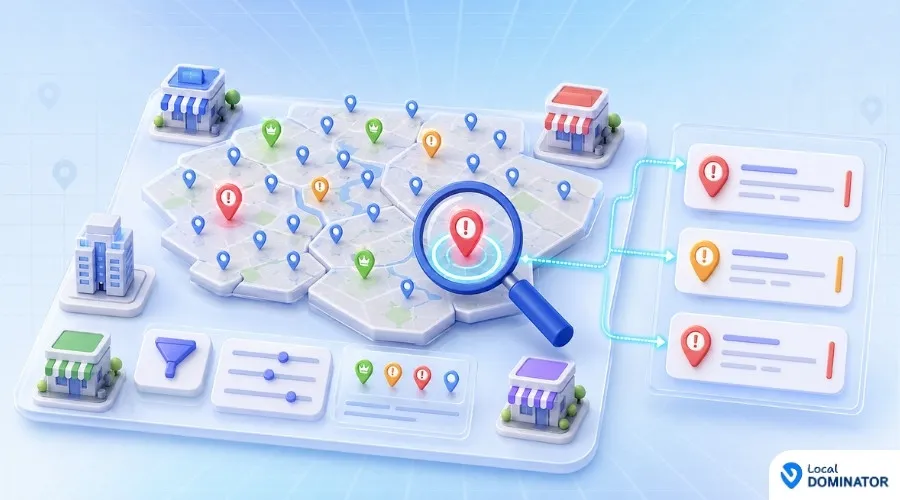
Tools built for rank tracking across locations handle this differently from single-site trackers. Some plot every tracked business on one map and color-code each marker by ranking health. Local Dominator takes this approach.
In its version, each marker shows a location’s average rank. Marker colors run from strong to invisible, so weak markets stand out before anyone opens a report. Nearby locations cluster together and separate as you zoom in, which keeps a 40-location footprint from turning into an unreadable pile of pins.
A weekly routine built on that kind of view runs in four steps:
Run in that order, the review gets shorter and attention lands on the markets where revenue is at risk.
When to Open a Single-Location Rank Scan
A map of all locations and a detailed scan of one location answer different questions, and founders need both in the right order.
A portfolio-level view answers “which of my businesses is weak?” A street-level heatmap, often called a geogrid scan, answers “where inside this location’s service area is it weak?” You use the first to decide where to spend the week and the second to decide what to change inside a single market.
Having a portfolio-wide map sit above the detailed scans keeps the process efficient. You spot the weak marker in the overview, then open the geogrid for that single location to see whether the weakness covers the whole service area or only one side of town. Those two results call for different work, so know which one you are looking at before deciding what to change.
Using Multi-Location Rank Tracking for Budget and Expansion Decisions
Tracking earns its keep when it changes a decision. Three places founders put this data to work:
Expansion planning. Before opening a new location, look at how existing locations in similar markets rank. A pattern of weak visibility in dense urban areas, for example, is worth knowing before signing a lease.
Local marketing budgets. Spend where the gap is. A location ranking in positions 11 to 19 is often a better investment than one already in the top 3, because the upside of moving onto the first screen is large.
Franchise and location manager accountability. A shared, color-coded view makes ranking health visible to everyone, and the conversation moves from “is local search working?” to “why did this market slip last month?”
Wins deserve the same attention as problems. When one location climbs, find out whether more reviews, updated business details, or new local content drove it, then test the same steps in a comparable market.
Final Thoughts on Multi-Location Rank Tracking
Multi-location rank tracking works when it changes where a founder looks first. Start with one map of every market, investigate the clusters, and save street-level scans for the locations that earned them. The goal is a shorter weekly review that points attention at the markets where customers cannot find the business.
Multi-Location Rank Tracking FAQ
What is multi-location rank tracking? It is monitoring the local search rankings of every location of a business in one place, so owners can compare markets and prioritize the weakest ones instead of reviewing each location separately.
I run 15 locations. How do I decide which one to fix first? Start with a single map of all locations color-coded by ranking health. Look at clusters of weak markers, then locations whose color changed recently. Open a detailed street-level scan only for those.
Is a good average rank across locations enough? No. An average can hide individual locations ranking outside the top 20, and only location-by-location visibility shows where customers cannot find you.
How often should a growing business review local rankings? Weekly is realistic when the review starts from a portfolio overview. Monthly reviews tend to let problems compound between checks.
About Local Dominator
Local Dominator is a local SEO and AI search visibility platform built by a team of agency veterans and local SEO professionals. It helps marketing agencies and local businesses track and improve how they rank across Google Maps, search results, and AI answer engines from one dashboard, with rolling credits, bulk actions, and transparent, no-hidden-fee pricing.